What Your Document Analytics Are Actually Telling You (And What to Ignore)
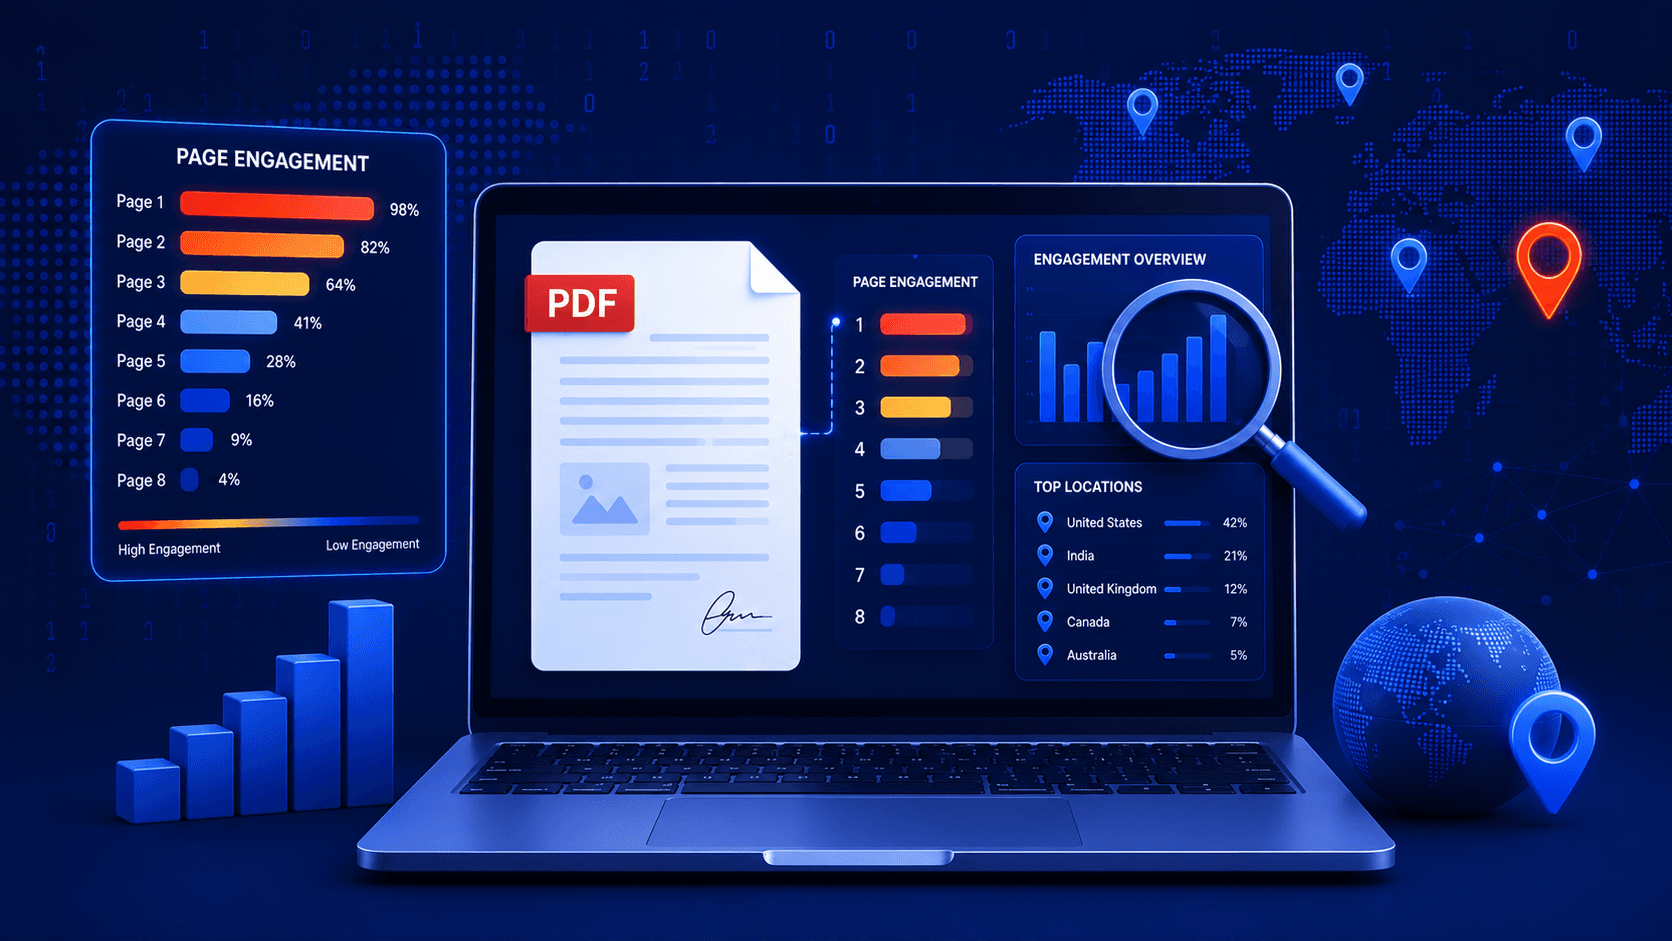
Every share link generates a stream of numbers — total views, time on page, geo-location, a heatmap of which pages got attention. It's easy to stare at a dashboard and treat every number as equally meaningful. Most aren't. Here's what's actually happening behind each metric, and how to read it correctly.
Where the Data Actually Comes From
Two systems feed document analytics, and they measure different things:
- Client-side page events — as a viewer scrolls through the PDF, the viewer fires presence events per page, which is how time-on-page and page-level heatmaps get built.
- Server-side geo-IP resolution — the IP address behind each session gets resolved to an approximate city/country in the background, which is what populates the location breakdown on your dashboard.
These run on different timelines. A view shows up in your total count immediately; the geo-location for that view can take a moment longer to populate, since it depends on a separate resolution step.
The Metrics That Are Genuinely Reliable
Total Views (With One Caveat)
This counts real, quota-relevant views — with one deliberate exception: the document owner's own views don't count. If you open your own shared link to check formatting, that shouldn't inflate your view count, skew your analytics, or trigger a "someone viewed your document" notification. It's excluded on purpose, not a bug.
Page-Level Time
This is the single most useful number on the dashboard, because it's the hardest to fake and the easiest to act on. If page 4 of your pitch deck gets 45 seconds and page 5 gets 3, that's not noise — that's a direct signal about what's landing and what's being skimmed.
Drop-off Point
Where a viewer stops advancing through the document — closes the tab, or simply never scrolls further — tells you almost exactly where you're losing the reader's attention. A drop-off that clusters at the same page across multiple viewers is a strong signal that page needs to be reworked, not a coincidence.
The Metrics That Need Context Before They Mean Anything
Geo-Location
City/country data is useful for confirming a viewer is who you expect ("was this opened from the prospect's HQ city, or somewhere unexpected?") but it's an approximation — IP-based geo-resolution can be off by a city or more, especially for viewers on VPNs or mobile carriers. Treat it as a directional signal, not a precise location record.
Raw View Count on Its Own
Five views could mean one engaged reviewer who reopened the document five times, or five different stakeholders each looking once. Without pairing view count against unique sessions or email-gated identities, the raw number tells you less than it looks like it does.
"Time Since Last View"
A long gap since the last view doesn't necessarily mean disengagement — it might just mean the recipient is waiting on something else internally before circling back. Useful as a follow-up trigger, not as a verdict on interest.
A Pattern Worth Watching: The Skipped Section
If a specific section — pricing, terms, appendix — consistently gets near-zero time across multiple different viewers, that's rarely coincidence. It usually means the section is either confusing, poorly placed, or the reader already decided before reaching it.
This is the pattern most worth building a habit around: don't just check whether a document was opened — check where in it people stop paying attention. That's the data traditional email attachments never gave you at all.
What Analytics Won't Tell You
Worth being direct about the limits:
- It tells you that a page got attention, not why — you still have to interpret intent
- It can't distinguish "read carefully" from "left the tab open while doing something else"
- Aggregate patterns across many viewers are far more trustworthy than any single session's data
Conclusion
Document analytics are most useful when you treat page-level time and drop-off points as the primary signal, geo-location and raw view counts as supporting context, and no single session as gospel. The dashboard isn't there to replace judgment — it's there to tell you where to apply it.
See what your own documents are actually saying. Every PdfWarden share link includes page-level analytics and geo-insights by default. Start free and check your next shared deck.
Advertisement
Share this article
Ready to share documents securely?
Upload your first PDF, create a secure share link with custom access rules, and track every view in real-time.
Start Sharing Securely